A New Challenge at Crane Worldwide

Summers are meant to be relaxing, go around and explore the sunny east coast, but this summer wasn’t one for me because I took a life changing decision – Yes, I accepted a new position with Crane Worldwide Logistics as a BI Architect and moved to Houston, Texas.

Why did I accept a new position?

Well, I was working with my prior Employer and Client for about 4 years and I felt I have reached a saturation point in terms of job challenge and growth. I have seen my skill set grow from a technical to Business & Analytical person and the credit goes to my previous Boss (Jason C) who pushed me to learn beyond my boundaries. When this offer came, my first instincts were this job would be a great opportunity to implement all my learning. This move was one of the toughest decision I had to take so far in my life – I did think through a lot to leave an Employer like client and a Mentor like boss and a friendly Employer, I am grateful to them both.

What’s Crane Worldwide?

Crane Worldwide is a Full-service air, ocean, customs brokerage and logistics company, it has been into business for last 8 years and have achieved significant growth in terms of revenue and resource. The company is now in its tipping point and business intelligence is one of the key factor they are investing at.

How’s new job?

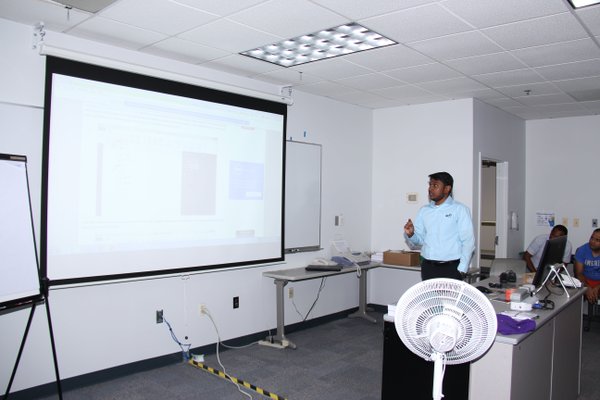
It’s been 3 months and it was super-fast and challenging, it’s a new industry to me and there was a lot of learning and have still covered only a drop in the ocean of logistics. I was very much intrigued by the startup like work culture and the responsibility they trust you with. I was able to carry out my first upgrade deployment and to come up with an execution strategy and vision. A part of my job duty is to evangelize the BI initiative through training’s to have all the users on-board with us, I do see a lot of momentum for BI and am looking forward to keep up and move forward!

How’s Houston?

Houston is hot, humid and always reminds me of my hometown Chennai, it’s a large and busy city where you get to spend a considerable time on road, though you like it or not:). We are slowly getting accommodated to the new city and it’s extremely different when compared to Baltimore and its cold climate, will surely miss/escape the snowy days and now I can never miss/escape the rainy days:( I miss all the good hearts I met at Baltimore and I hope all my friends and colleagues reading this blog are fine,Take care:)

-Junaith Haja


Becoming a Speaker

One of my goals for 2016 is to speak at a local SQL Server User Group and a SQL Saturday event. Am very glad both of my goals did come to fruition before end of Q2.

I wanted to pick a unique topic for my presentation and Power BI Desktop Fundamentals was an apt choice for it. It was a new tool and very less people know about it and hasn’t been presented in my local user group. I focussed on developing a 101 course on Power BI covering the basics from top features, creating dashboards and story telling with it.

I got an opportunity to present it on April 19,2016 at Charles I. Ecker Business Training Center of Howard Community College for Baltimore SQL Server User Group.

This was how I looked while presenting:)

Junaith at BSSUG

Had to rush to the meeting after my work hour and while setting up the projector it didn’t work, I got very tensed and found a work around..phew!! FInally when I started presenting everything got settled!

Out of humility, I should say it was  huge success and no one slept in the room:) Lot of good questions from the audience and I was surprised to see many companies have started to use it.

I was deeply moved by the comments.

Mark


Vakul


Thank you Jeremy Kadlec and the Sponsors for giving me the opportunity.

Speaking at SQLSaturday Baltimore;

On April 30, 2016 I got a chance to speak at SQL Saturday Baltimore BI Edition it was a dream come true moment to share the stage with MVP’s and other expert.

We had a nice Speakers Dinner at a Turkish restaurant and hundreds of people attended the conference next day, the whole event was organised by huge efforts of Slava Murgyin and Ravi Kumar, kudos to their hardwork.

My Badge!!

My Badge!!


With Ravi

With Ravi


I was really motivated by these opportunities and want to keep this going and during Q3 I want to take it to next level and present a Power BI Advanced topic.

Hope I do it!!

Getting started with R scripts and R visuals in Power BI Desktop

The Power BI team announced its support to create R visuals in its recent update and in this tip we’ll help you get started by walking through what R is, how you can configure Power BI Desktop to run R scripts and create R visuals in Power BI desktop.

R is an open source and powerful statistical programming language used by statisticians, data scientists and researchers for data mining and data analysis. R scripts can be written using an IDE (Integrated Development Environment) like RStudio, Revolution-R and Live-R. If you are new to R, you can draw the following analogy of R to SQL queries for its application in Power BI Desktop. Like how a BI Developer creates queries in SSMS and uses it in a reporting environment such as SSRS, with this update we can use R scripts created in RStudio and use Power BI Desktop to create R visuals which will generate the same R visuals if they were to be created in RStudio.

Follow the rest of article from MSSQLTips.com

Create Bell Curve and Histogram with Power BI Desktop using DAX

Companies often use a Bell Curve approach to measure performance of various aspects of the business, such as employee performance. A histogram is a statistical concept and according to Wikipedia it is defined as “a graphical distribution of the numerical data”. A histogram is made of several bins and a bin can be considered a range of values or a benchmark.

As part of this process, we have to divide the entire range into multiple bins and the range should be unique and continuous. Our grades in high school (i.e. A, B, C, D, E, F) can be considered an individual bin. If a teacher plots the student marks across the grades (bins) in a bar chart it sometimes follows a bell shaped pattern with a mix of high grade, medium grade and low grade students which could be used for assessing students. The same could be applied at company level by plotting an employee performance metric across bins to understand and assess employees.

Follow the rest of the article from here

3-D’s of Business Intelligence

A friend of mine aspiring to become a BI professional asked me what it takes to become a Business Intelligence professional?

Since the answer to the question is not a one liner I thought of answering it in a post as it will helps others.Before we get in detail let me define BI first,”Business Intelligence is the process of getting useful  and simpler analytics about business from its raw data sources“.

With that being said, it takes one to master 3-D’s (Data Building. Dashboards and Decision Making) to become a successful BI professional.

Data Building: Building your data from raw data sources is fundamental and crucial part of Business Intelligence. One should not use the data directly from real time systems for analytics – the reason is most of the time a company’s data systems are designed in the form of numerical values for easy computing and the numerical data doesn’t makes sense unless Attributes are added to it. Data building is like laying a foundation to your house, so extensive care and research should be taken at this step to avoid future costs.

Depending on the organization size your data building specs might change.Say If you’re a small company, I wouldn’t suggest you for a data warehousing and you can build one Master table from your Work orders or invoices and add multiple metrics to it.

Say If your company is dealing with lot of media files, I would advise you to have a non relational Hadoop kind of database like Azure.

Say if you’re running a massive Billing and Support Call center and  has to deal with tons of invoices and call volumes, a good approach is to have a datawarehouse  and track everything.You can have a combination of Type1 and Type2.

Key Tools and Technologies: SqlServer,Oracle,Teradata,Apache Hadoop,Azure

Dashboards: Once your data is built, the next step is to derive useful information from data in form of reports. By saying reports, I don’t mean long tabular ones- Why do I say that? Working with executives made me learn this trick,let me say it out for you. “Data doesn’t lie at detail and summary level“. You don’t need to have long detailed tabular reports to understand your business you can have them summarized by multiple metrics in a single dashboard. What if you don’t have one?try to combine as many reports as possible and summarize them. Dashboards allows us to view the business through different angles and gives deeper insights in a single view.

Key Tools and Technologies: Power BI, Tableau, SSRS, Business Objects and Excel

Decision Making: One may think a BI professional’s job concludes by creating dashboards. I wouldn’t agree with it, go ahead and analyse the dashboard and try making decisions yourself as if its your own company. This will embark a business mind in you, you may not become a business person overnight but with time it will increase your learning curve and establish yourself as valuable asset to your organization.

Would’t it be nice if you hand over a deck to your supervisor and say “I looked at it and our sales are dropping due to less price offers by our competitors”

Key Tools and Technologies: Your own Brain and curiosity.

Hope it helps:)

Baltimore Ravens Performance Report

I have never been a Foot Ball fan in my life but I wanted to follow this NFL season and support my home team Baltimore Ravens. I wanted to know more about team Ravens over the years and their performance, other than the fact they won the Super Bowl in 2012 (When I moved to Baltimore:-)).

So, I need a Performance Report for team Ravens and I know for sure, Power BI will be the best choice for this analysis. Quickly opened a new project in my Power BI Desktop and connected to the Source  by Get Data –> From Web option and fetched the data I needed.Power BI Desktop was handy enough and was able to create the following dashboard within 30 minutes.

 Baltimore Ravens Dashboard

As the scope of this article is not related to creating this dashboard and it is only to analyze and understand team Ravens, let’s get started.

The top most chart shows the Regular season – Win and Loss by Baltimore Ravens from 1996 till last year.

Sort by Won and Loss Befor Sort

A team will play 16 regular games to qualify for the Play offs (next level). From initial analysis we can find Ravens has a good mix of Loss and Win from their start.When you hover the mouse over the top right corner and sort the report by Won.

It gets sorted like,

Sort by Won and Loss After Sort

From this we learn, Ravens won maximum games in 2006 with 13 wins and lost the most in 1996 by losing 12 games.

The Second Chart shows the Loss and Win by Coaches and Bellick is the most successful coach with 80 wins and click the mouse over Bellick in the chart.The dashboard returns data only for Bellick like below.

Belllick Successfull Coach

 We can infer, Bellick is the most successful coach for Ravens and served for 9 seasons from 1999 to 2007.

Let’s look at the third chart, it’s pretty clear Ravens won the Super Bowl title for 2 seasons by clicking the Won SB data field, we learn Ravens won in 2000 and 2012.

Won Two Super bowls

AV is the approximate value calculated for a player and Ray Lewis topped the team for 8 years.

Ray Lewis Topped


Let’s look at our final chart Offensive and Defensive trend rating.

Offensive and Defensive Trend

For a good team their offensive and Defensive rating should be positive. The historic trend shows Ravens was a better defensive team.

I filtered the report to show the trend only for the years they made to Playoffs.

Playoffs Offensive and Defensive Trend

Surprisingly, they had both their Offensive and Defensive ratings as positive for these years which made them in to playoffs

Note: Read the article again, all the bold sentences are our learning’s from the dashboard.

Hope you have learn’t about Ravens, feel free to post your thoughts in the comments section.

#BaltimoreRavens #GoRavens #NFL #GameDay #PowerBI #Junaith Haja

SQL Recovery Software for Microsoft SQL Server Database

SysTools SQL Recovery software  is a Windows based solution that specializes in recovering data from MDF and NDF files. The software is small sized, works with basic system requisites, and is integrated with varied features that supports customization of recovery procedure as per user requirement. The product is quite promising for its quality to restore all components of SQL database that includes views, tables, stored procedure, functions, keys, etc. Its ability

Available Options and Capabilities:

  • Table records that were deleted from SQL database can be recovered with the tool. Table recovery from both primary and secondary DB is supported.
  • The scanned copy of corrupted MDF or NDF file can be saved into .str file. If the same data has to be processed by the tool, the .str file can be added.
  • Works on SQL databases that cannot be fixed using built-in commands and tools. Recovers data from system databases that have intense corruption problem.
  • SQL variables or columns that that are created in XML can be recovered with the software.

Detailed Functionality of Tool:

The SQL database recovery tool has some highly beneficial attributes that makes the recovery process absolutely swift for the users. Let us have a discussion over them to know the tool better.

1) Dual Options for Scanning SQL Database: The software is integrated with two options for scanning the selected MDF and NDF files. One is Quick Scan that is for faster recovery of data from the file and another is the Advance scan that is recommended to be chosen for accurate scanning and recovery results.


Dual Options for Scanning SQL Database

Dual Options for Scanning SQL Database

2) Preview Components of Database on Screen: After recovery of SQL primary and secondary database, the software will give a preview of all of its items. Tables, triggers, views etc. can be checked out by expanding the hierarchical structure which is similar to object explorer of SSMS.

Preview Components of Database on Screen

Preview Components of Database on Screen

3) Export Recovered Data Accordingly: Once the data is recovered with the tool, it can be exported into SQL Server or into SQL compatible scripts. Any of the option can be selected according to convenience:

Export to Live SQL Server: If SQL Server is available, then database can be directly exported into it. For utilizing this option, the name of server, username, and password (according to authentication) has to be provided.

Export as Compatible Scripts: In case live SQL Server is not available, then in that case the recovered database can be saved into compatible scripts that can be saved on local machine.

Export Recovered Data Accordingly

Export Recovered Data Accordingly

4) Database Export with or without Schema: If the underlying schema of the database has to be exported along with the database, then this can be made possible with the tool. There is optional facility in the tool for exporting the recovered database without or with its schema.

Database Export with or without Schema

Database Export with or without Schema

5) Restore Deleted Records from Table: If records from SQL database are deleted, then they can be recovered and exported. While the software is instructed to export the database, it prompts for user permission for exporting the records that have been deleted from tables.

Restore Deleted Records from Table

Restore Deleted Records from Table

I tested a trial recovery of my database and it turned out pretty well and am planning to publish a video blog of it in the future.

Overall, I would like to give SQL Recovery 4 stars out of 5.

The software works for all versions of SQL Server: 2000, 2005, 2008, 2012, and 2014. In addition to this, export to all latest editions is supported. 

Download and Purchase:

The product is available for trial and its license can be purchased from official website of the product: http://www.systoolsgroup.com/sql-recovery.html

Creating a SSRS report to show SSIS package run time statistics

In most companies developers are restricted from accessing the MSDB database and they rarely know the performance of their packages in a production environment unless they have access to third party software tools or a friendly DBA. This happened to me once when I wanted to know how long my packages ran in a production environment and I had no access to the MSDB database to look at the sysjobs and sysschedules tables. The work around is to enable SQL Server logging in SSIS packages and to create a SSRS report from the sysssislog table.

The logic behind this solution is to enable SQL Server Logging in SSIS packages while we create/develop the package and send it for deployment.

Follow the rest of the article from here

Back From Vacation Syndrome and SSMS Shortcuts

Was just back to United States from a long vacation and started to work. The first two days were filled with replying to all pending emails and settling up issues reported while I was away. Slowly was out of jet lag and my routine work life started. My client did gave me a new requirement to build a report. Came to my cubicle, opened SQL Server Management Studio (SSMS) and started building the query for it. With me being away from work for few weeks, I thought I might have forgotten the tables, databases and relationships which exists between different database objects.

To my surprise, I didn’t forget any and I painted the whole picture of the report from different tables in my mind when my client gave the requirement. While building the query I noticed something strange, I have been stumbling with keyboard shortcuts I use with SSMS and just took a breath and yelled at myself (How could I?). Shortcuts are cool feature with SSMS and I love using them. I know I should get into my notes and brush up my shortcuts.

This time I wanted to know why did I forget them and started googling about it. The one word answer is Brain Plasticity. The ability of our brain to be flexible and adapt with new changes is called Brain Plasticity and our brain survives by forgetting too. The article I read quoted human brain doesn’t need to forget intentionally and any changes in the outside environment has an effect on our brain and it will make us forget to store new events. Think of it in this way, If I were to think about SQL and databases at my vacation it might have gone terrible right?, luckily I wasn’t and my brain was on vacation mode and now am back to work it will slowly store my work and daily life related data and events and might forget vacation mode and it keeps working!!!Amazing is our brain!!!

I just called it as Back from Vacation Syndrome:)

Here are the shortcuts I brushed up from my notes and would like every SQL Developer to be aware of it and forget only when they are on vacation:P

Ctrl + U  - To Change database connection

Ctrl + F6 – Toggle between query windows

Ctrl + F5 – To parse the code

Ctrl + R – To Toggle Result Pane

Ctrl K + Ctrl C – To Comment the code

Ctrl K + Ctrl U – To Un Comment the code

F8 – To view Object Explorer

Shift + Alt + Enter – To view in Full Screen

Ctrl + Shift + U – Converts the selected code to Upper case

Ctrl  + Shift + D – Converts the selected code to Lower case

Ctrl + Shift + Home – Selects the code from current cursor location to the beginning of query

Ctrl + Shift + End – Select the code from current cursor location till the end

Share with me if you find some more shortcuts are essential.

#JunaithHaja

Your development time is as important as others

I worked in an agile environment where our team gave updates to our Team Lead every day at 8:45 am. Ours was a team consisting of 8 developers and over the days our team encountered issues like “I have sent email to such and such person and he/she hasn’t responded to me yet which stalls my development time” as matter of fact this wait happened within our own team members and the other member response would be, I was busy working on other request. I would simply call this scenario as Delayed Resource Response where one team member awaits response from the other developer or analyst which stalls his own development time.

Our Team Lead was the one, who insisted to record all the business requests and clarifications either via email or a chat system which is an accepted practice to communicate with clients and our team but sooner does he realized it isn’t going to work all the time. To illustrate further, Consider Developer A sends an email to Developer B asking for a clarification and he gets a response after 2 hours where Developer B is his own team member who sits across five cubicles from Developer A. The wait time for Developer A was 2 hours. In a team consisting of eight members working on a project with lot of dependencies, let’s assume each developer experiences this wait at least once in a week, which adds to 16 hours of development time being wasted and monthly it will be a whopping 64 hours of development time. It became a recurring issue in our team and we did see it hindered our development.

What fascinated me was how my Lead handled the situation? My Lead did a 180 degree turn from his stance and in one standup meeting he informed us not to rely upon email for clarifications anymore and to step into the developer or analyst cubicle and address them the concern directly. I still remember his words,” Just go to the Developer’s desk and ask your questions, I take my words back! And remember your development time is as important as others” which was a polite way of saying one should give equal importance to others development time like his own.

The outcome of this change was phenomenal and increased the member to member communication and augmented our development without waiting for responses. To keep in note, this change was done only for clarification type emails and for business requests we continued to keep them in email. To summarize, Emails are best ways to communicate within an organization but not always effective and we should be dynamically ready to adapt any sort of communication within an organization to help us serve better.

Disclaimer: Please don’t try to step in to a Developer’s cubicle if they are located offshore:P

#JunaithHaja