I have never been a Foot Ball fan in my life but I wanted to follow this NFL season and support my home team Baltimore Ravens. I wanted to know more about team Ravens over the years and their performance, other than the fact they won the Super Bowl in 2012 (When I moved to Baltimore:-)).
So, I need a Performance Report for team Ravens and I know for sure, Power BI will be the best choice for this analysis. Quickly opened a new project in my Power BI Desktop and connected to the Source by Get Data –> From Web option and fetched the data I needed.Power BI Desktop was handy enough and was able to create the following dashboard within 30 minutes.
As the scope of this article is not related to creating this dashboard and it is only to analyze and understand team Ravens, let’s get started.
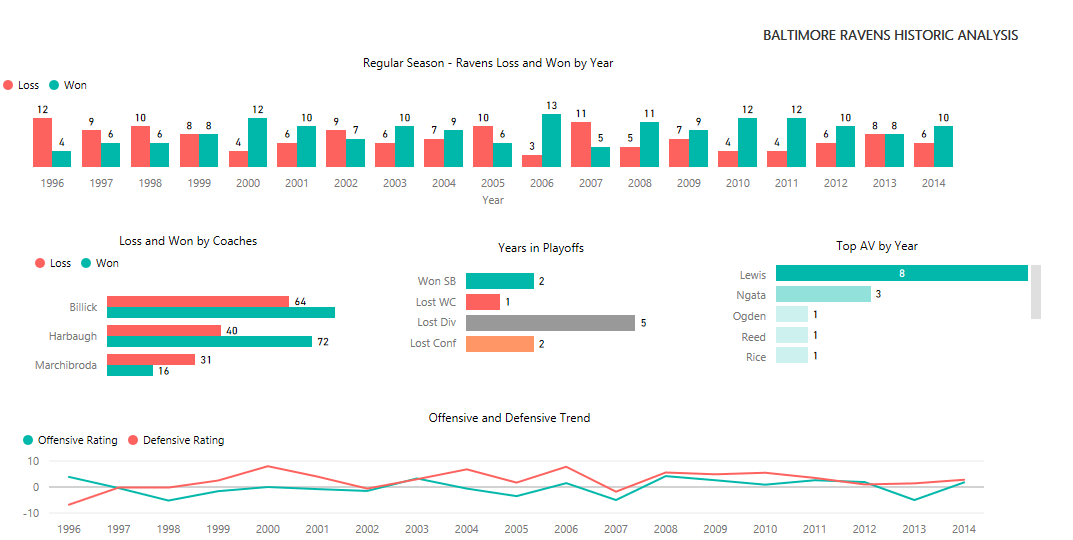
The top most chart shows the Regular season – Win and Loss by Baltimore Ravens from 1996 till last year.
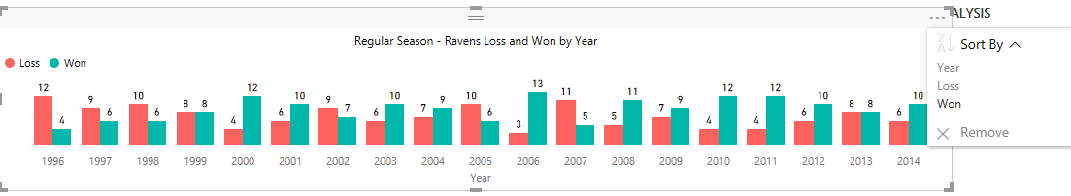
A team will play 16 regular games to qualify for the Play offs (next level). From initial analysis we can find Ravens has a good mix of Loss and Win from their start.When you hover the mouse over the top right corner and sort the report by Won.
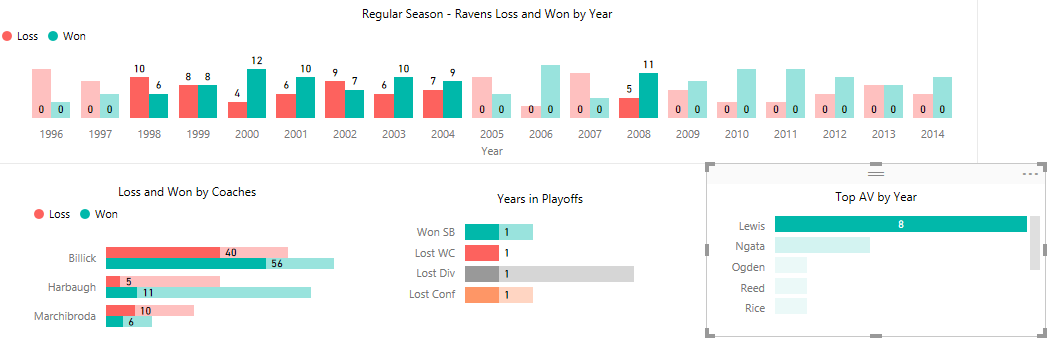
It gets sorted like,
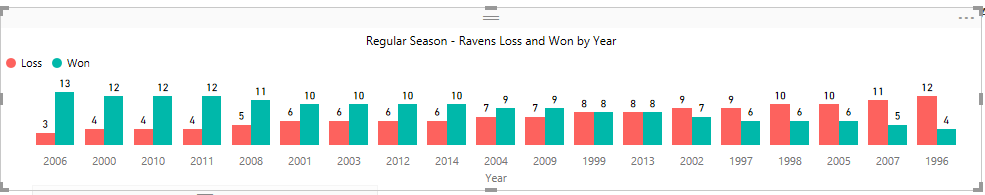
From this we learn, Ravens won maximum games in 2006 with 13 wins and lost the most in 1996 by losing 12 games.
The Second Chart shows the Loss and Win by Coaches and Bellick is the most successful coach with 80 wins and click the mouse over Bellick in the chart.The dashboard returns data only for Bellick like below.
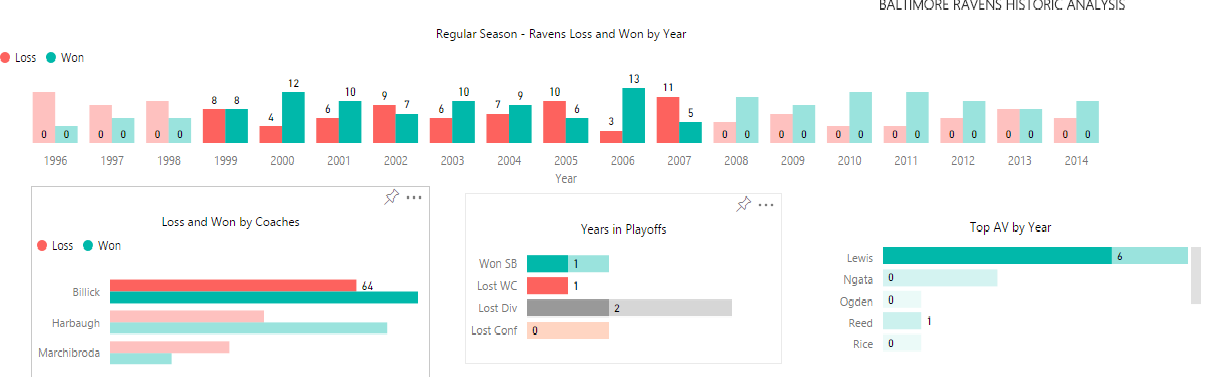
We can infer, Bellick is the most successful coach for Ravens and served for 9 seasons from 1999 to 2007.
Let’s look at the third chart, it’s pretty clear Ravens won the Super Bowl title for 2 seasons by clicking the Won SB data field, we learn Ravens won in 2000 and 2012.
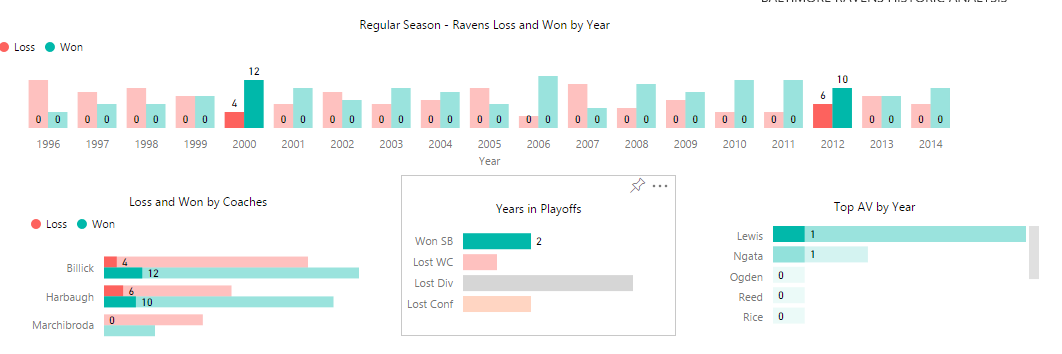
AV is the approximate value calculated for a player and Ray Lewis topped the team for 8 years.
Let’s look at our final chart Offensive and Defensive trend rating.
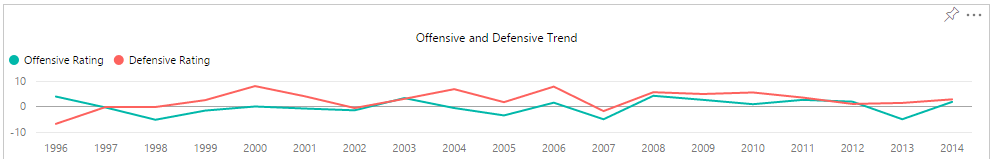
For a good team their offensive and Defensive rating should be positive. The historic trend shows Ravens was a better defensive team.
I filtered the report to show the trend only for the years they made to Playoffs.
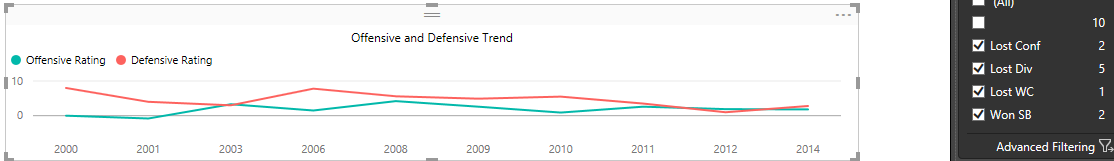
Surprisingly, they had both their Offensive and Defensive ratings as positive for these years which made them in to playoffs
Note: Read the article again, all the bold sentences are our learning’s from the dashboard.
Hope you have learn’t about Ravens, feel free to post your thoughts in the comments section.
#BaltimoreRavens #GoRavens #NFL #GameDay #PowerBI #Junaith Haja